Lundquist Urban Ecology Lab

Urban ecology in New York City.

Cities are growing around the world, changing the places where people and other species live. We study what those changes mean for biodiversity in urban parks, rivers, and green spaces.

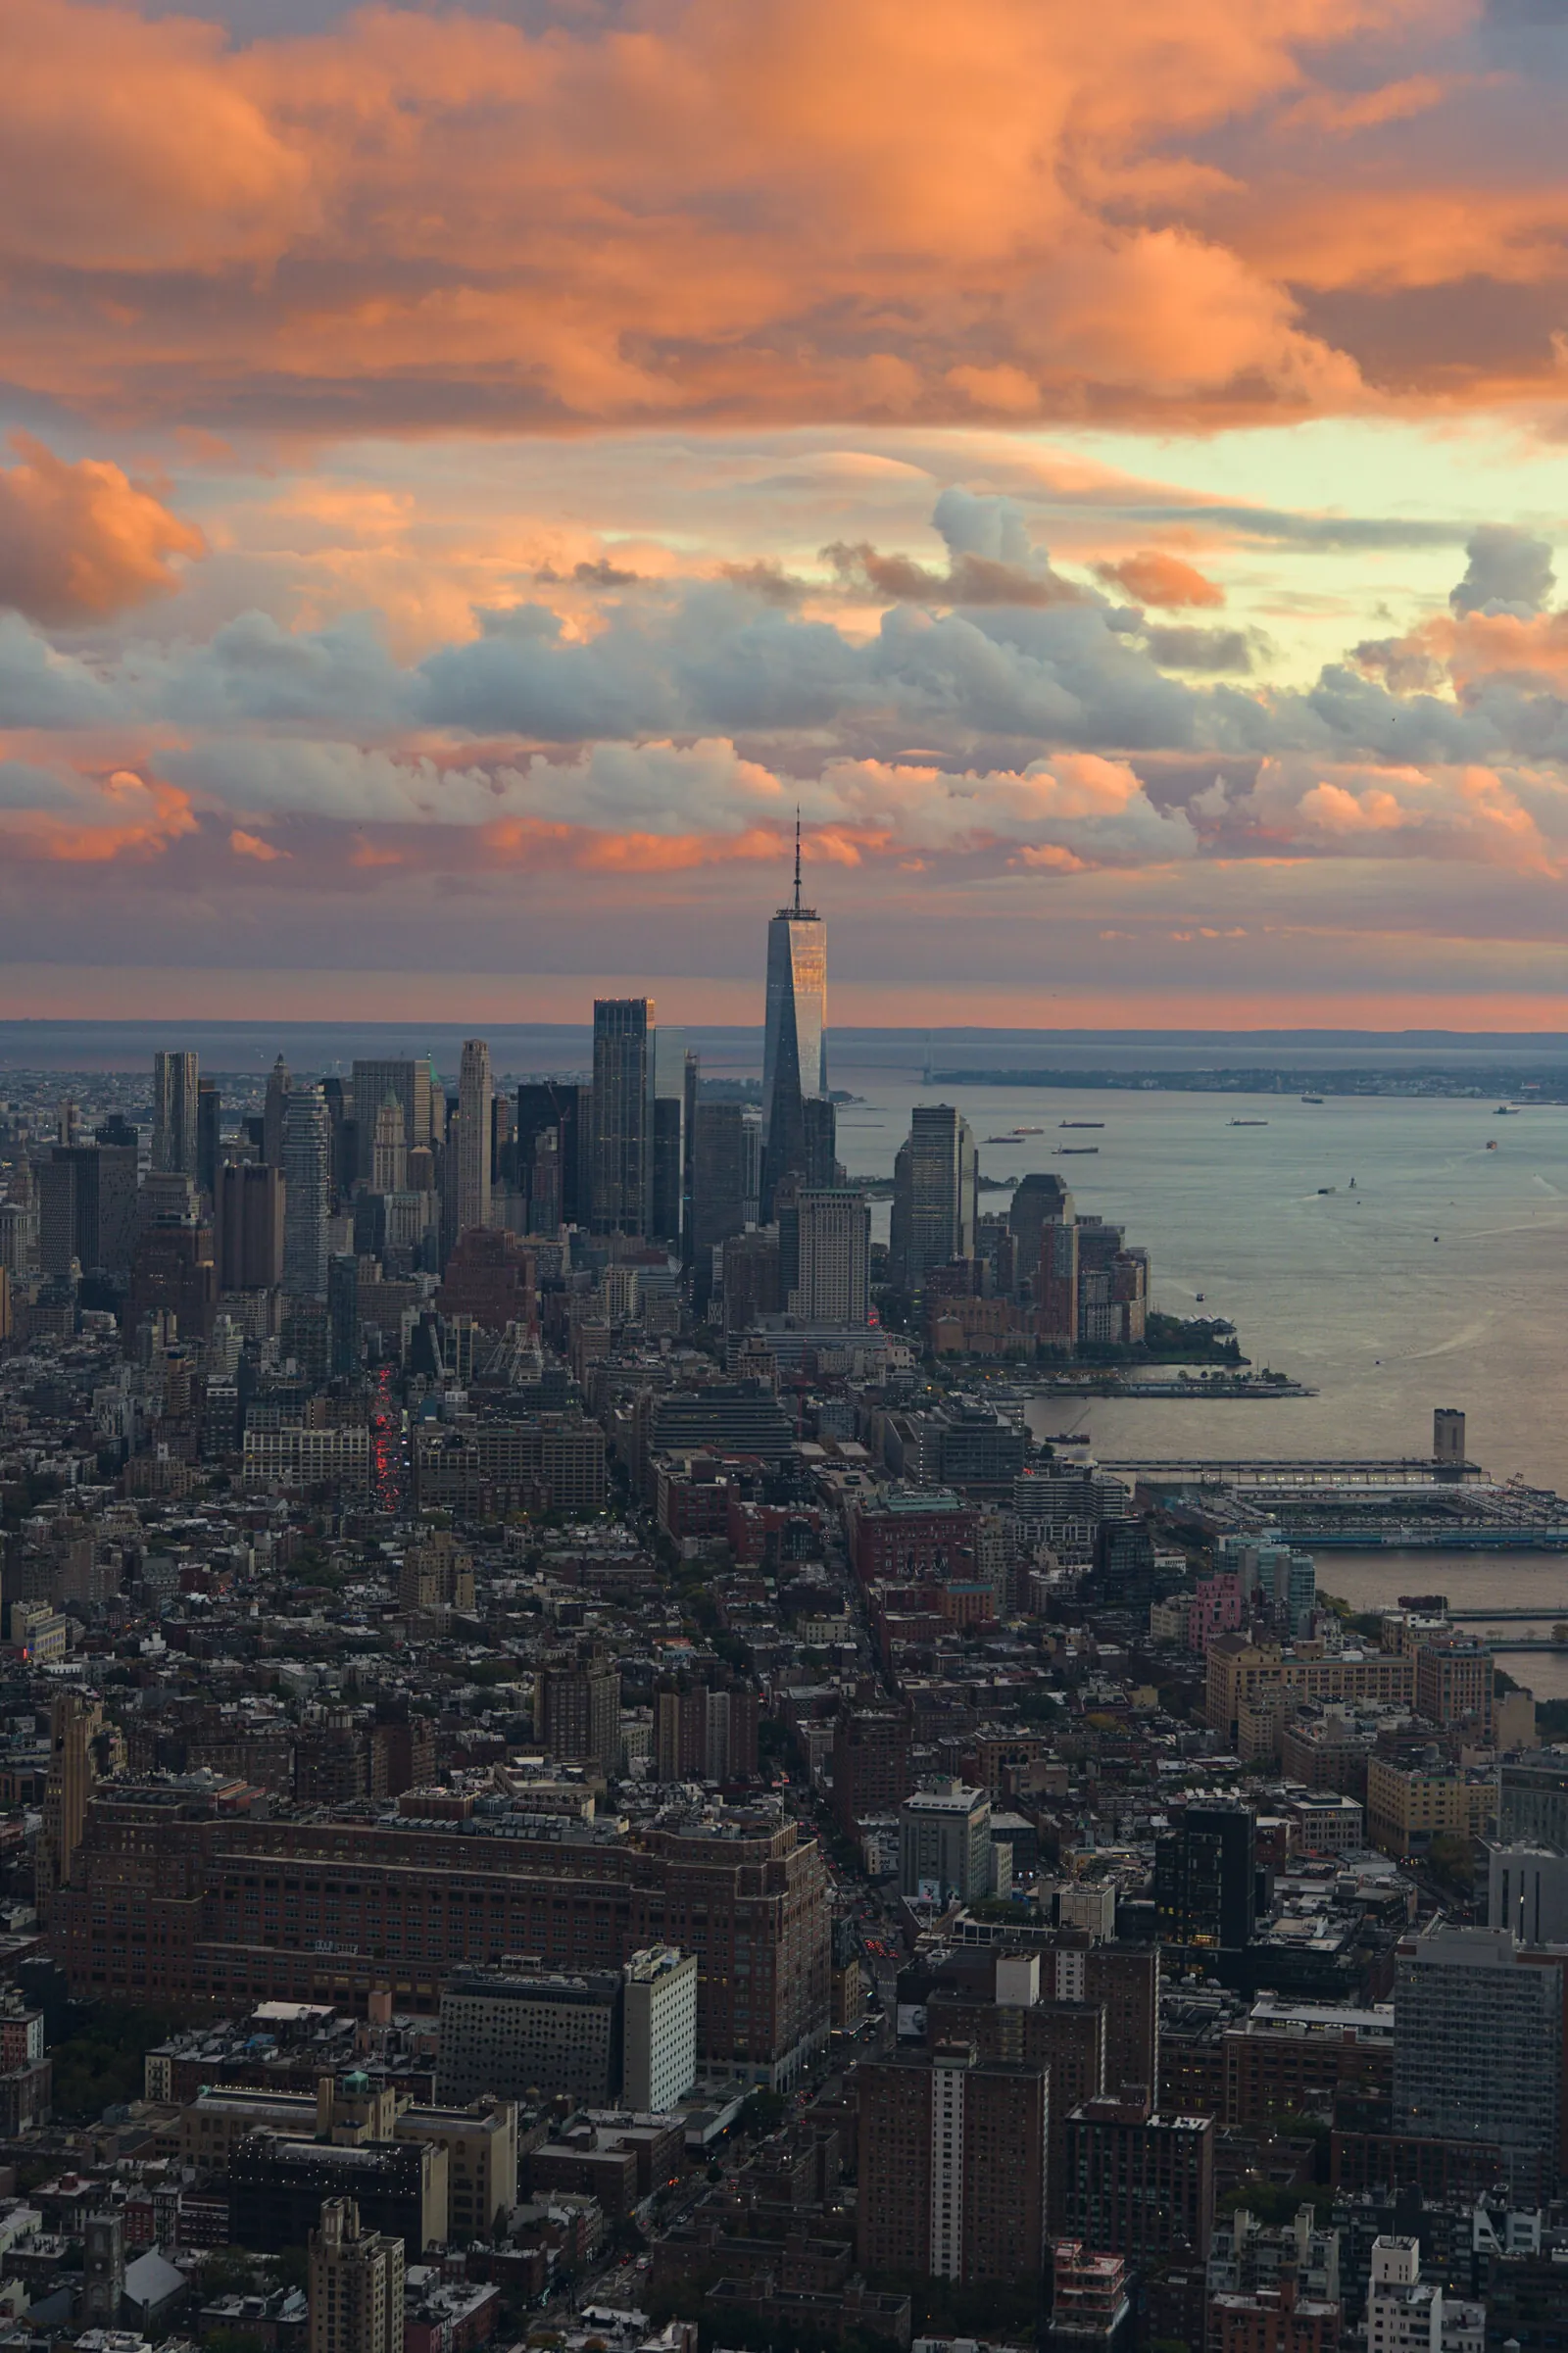
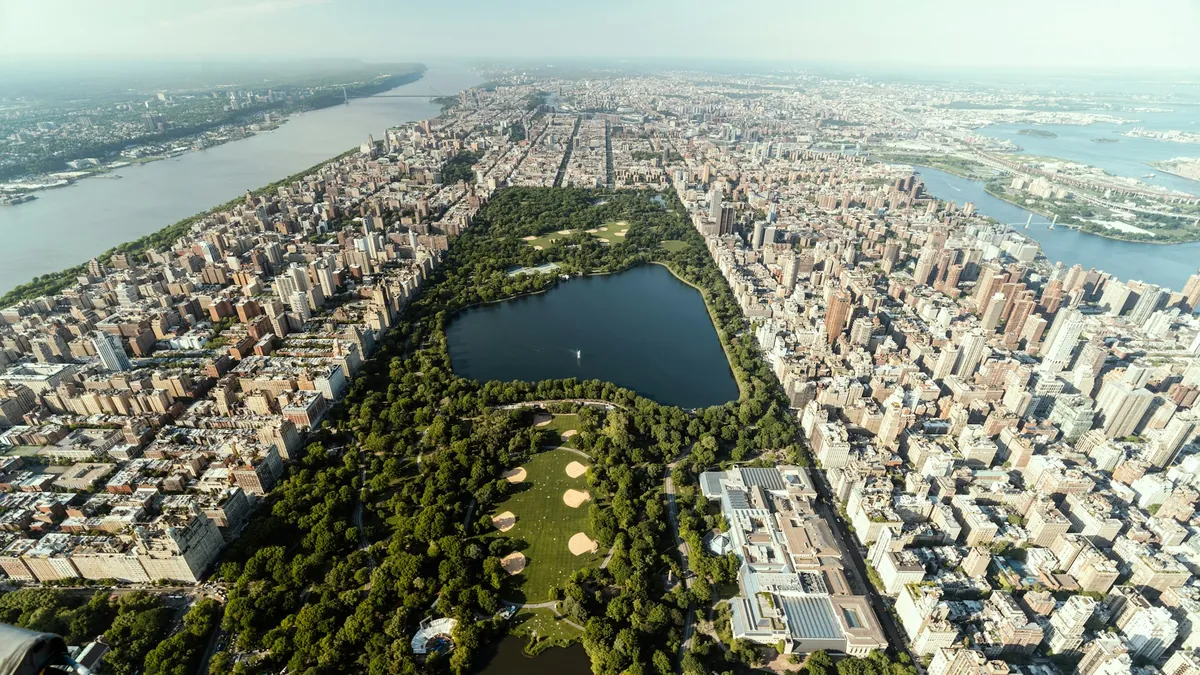
Urban ecology fieldwork in New York City

About the lab

Urban ecology, spatial analysis, and undergraduate research.

We study urban biodiversity in the field and use GIS, remote sensing, and spatial analysis to make sense of what we find. We favor open data and open-source tools so the work is easier to check, reuse, and extend.

Collaborative research

Students help shape each project from the start: they refine questions, design methods, collect observations, and work through what the results mean.

Current work

Research

Current projects span urban rivers, insects in small green spaces, connections among pollinator habitats, and the teaching of data-driven science.

What we ask

How does urbanization alter biodiversity, food webs, habitat connectivity, and ecosystem function?

How we work

Field surveys, GIS, remote sensing, graph analysis, computer vision, and open-source research tools.

How we share it

Papers, open-source mapping tools, public data projects, and teaching materials.

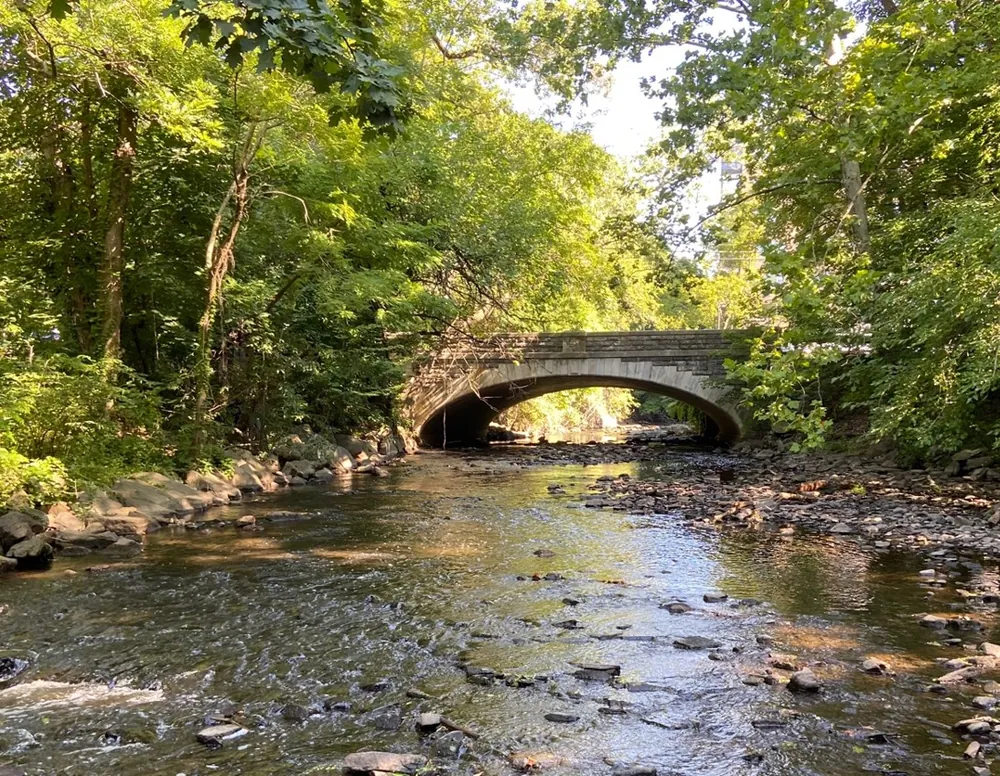
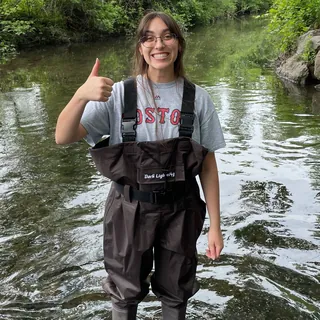
The Bronx River study system in New York City

Aquatic ecology

Urban rivers

Urban development can alter both sides of a river food web. In the Bronx River, blacknose dace, alewife, and American eel feed on aquatic macroinvertebrates. By surveying those invertebrates and examining fish gut contents, we can track how the food web differs across an urban watershed.

Study system
Bronx River watershed
Methods
Macroinvertebrate surveys, fish diet analysis, watershed GIS

Hernandez JE, Lundquist MJ (2025). Limited Diets of Eastern Blacknose Dace Within the Highly Urbanized Bronx River, New York, USA. Urban Naturalist Notes (12) N1–N7.

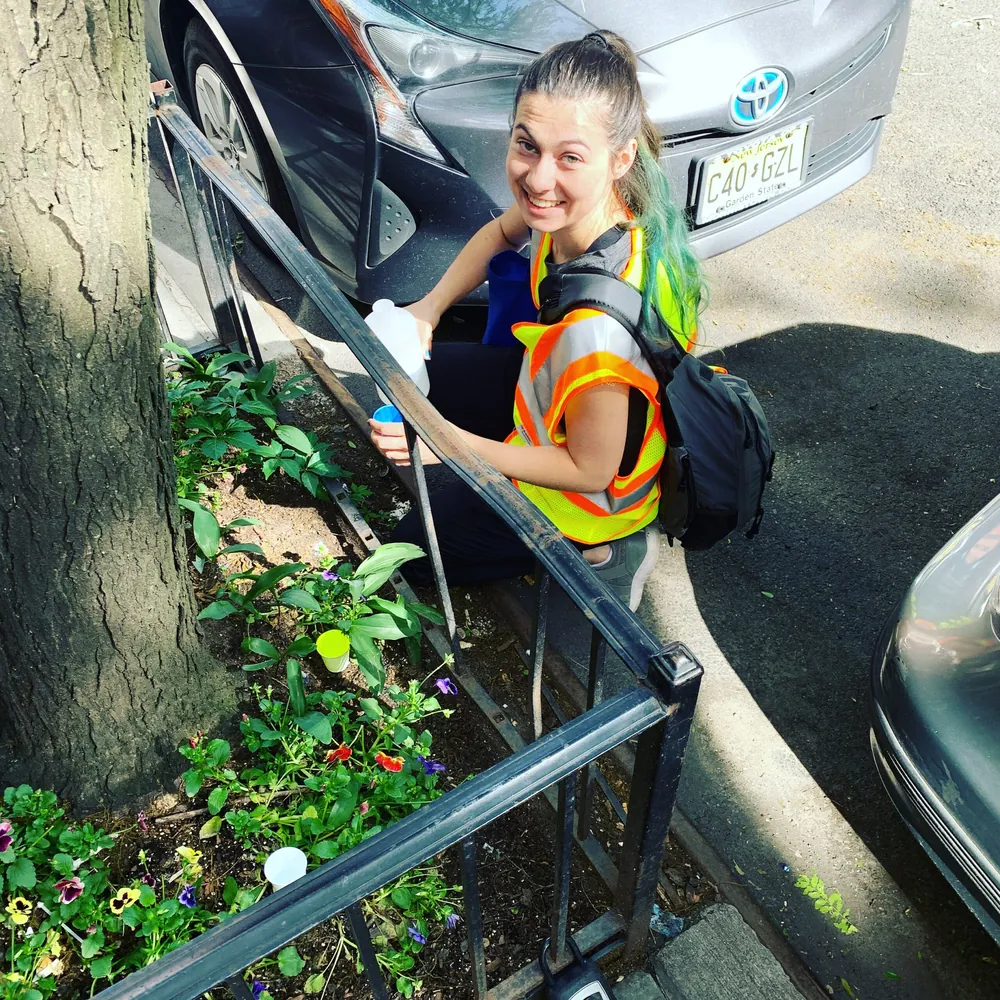
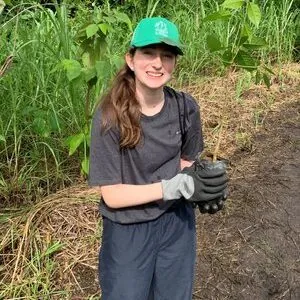
Student researcher sampling a New York City tree pit

Green infrastructure

Small green spaces

Large parks receive much of the attention in urban ecology, but smaller patches of green are everywhere. We study insects in New York City tree pits and other small green spaces to learn which species use them and how these easily overlooked habitats contribute to urban biodiversity and ecosystem services.

Habitats
Tree pits, green roofs, parks, and urban gardens
Approaches
Insect surveys, aerial imagery, LiDAR, machine vision

Lundquist MJ, Weisend MR, Kenmore HH (2022). Insect biodiversity in urban tree pit habitats. Urban Forestry & Urban Greening, 78, 127788.

Laptop used for programming and science education

Photo: Christopher Gower / Unsplash

Science education

Science pedagogy

We develop practical ways to teach data analysis, programming, and AI in classroom, hybrid, and remote science courses.

Courses
Ecology, conservation, biostatistics, and urban ecosystems
Tools
R, Python, interactive web applications, hybrid labs

Lundquist MJ and Aguanno A (2024). Here and there: a novel hybrid remote/in-person college-level science lab model at a small, primarily undergraduate institution. Journal of College Science Teaching (53) 205–210.

Across the lab

Projects underway

Spatial ecology

LiDAR vegetation structure and pathfinding

LiDAR separates vegetation into low, medium, and high layers that become movement-cost surfaces. For New York City, the analysis follows more than 74,000 routes between pairs of parks and measures cover, gaps, and possible stepping stones along each one.

  • LiDAR point-cloud classification
  • Least-cost paths and graph networks
  • 74,000+ NYC park-pair paths
Molecular ecology

Megachile texana genomic and microbiome analysis

Genomic methods and 16S rRNA sequencing let us examine the leafcutter bee Megachile texana together with its associated microbial communities. We are looking for changes along urban–rural gradients and asking how they relate to pollinator biology and local environmental conditions.

  • Megachile texana
  • 16S rRNA sequencing
  • Genomic and microbial diversity analysis
Remote sensing

Green-roof and canopy detection

Vegetated roofs and tree canopies often look alike from above. We distinguish them using NAIP multispectral imagery, LiDAR canopy measurements, NDVI, image texture, and building geometry.

  • NAIP and LiDAR processing
  • Computer vision and texture analysis
  • Interactive manual verification
Pollinator ecology

Pollinator corridor effectiveness

Do well-vegetated routes between parks correspond to richer pollinator communities? We compare corridor metrics with GBIF records while accounting for park area, isolation, and habitat quality.

  • GBIF occurrence records
  • Corridor quality and park connectivity
  • Regression and null-model analysis
Urban microclimate

Park cooling and thermal comfort

Transects from Manhattan park interiors into nearby streets record air temperature, humidity, and thermal comfort. We then compare the reach of each park's cooling effect with its canopy cover, size, surrounding urban form, and nearby building height.

  • Temperature and humidity transects
  • PET and UTCI thermal-comfort metrics
  • LiDAR canopy and urban-form predictors
Molecular identification

DNA barcoding of urban pollinators

Physical traits do not always settle a pollinator's identity. DNA barcodes provide a second line of evidence: we clean each Sanger sequence and compare it with reference databases before assigning a name.

  • Sanger sequence processing
  • BLAST species identification
  • Pollinator biodiversity records

Research practice

Methods, data, and teaching

Field observations, maps, code, and molecular data often meet in the same project. Students learn these methods by applying them to questions the lab is actively investigating.

01 · Spatial modeling

Connectivity and pathfinding

Graph and least-cost path models help us ask how buildings, streets, parks, and vegetation shape movement through cities. Depending on the scale of the analysis, the workflow may include QGIS, GeoPandas, Shapely, rasterio, igraph, spatial indexing, and PostGIS.

02 · Remote sensing

LiDAR and urban vegetation

LiDAR point clouds are classified into vegetation-height strata and combined with NAIP and satellite imagery. These data support vegetation-corridor models, park-cooling studies, canopy assessment, and computer-vision detection of green roofs.

03 · Molecular ecology

Genomics and microbial diversity

Our molecular work includes 16S rRNA analysis of bee gut microbiomes, genomic analysis of Megachile texana, and DNA barcoding of urban pollinators. Sequence-based identification complements field surveys and morphology-based taxonomy.

04 · Quantitative ecology

Statistics and reproducible computing

Analyses in R and Python cover diversity, community composition, spatial patterns, regression, null models, and networks. For larger projects, Docker, Git, shared data, and documented scripts keep the work organized and reproducible.

05 · Field ecology

Organisms, habitats, and microclimate

Field methods include aquatic macroinvertebrate surveys, fish gut-content analysis, pollinator sampling, riparian habitat assessment, and insect identification. New park transects connect temperature, humidity, thermal comfort, canopy cover, and surrounding urban form.

06 · Teaching and communication

Courses and public tools

Courses in ecology, conservation biology, biostatistics, and urban ecosystems use real data from research. GriffyStats and our interactive web applications make statistical lessons and New York City environmental data available beyond the classroom.

Selected publications

Recent work

  1. 2026

    Croman J.R. et al. (including Lundquist, M.J.). Limno-STOICH: a comprehensive database linking the elemental stoichiometry of organisms with inland aquatic habitats. Limnology and Oceanography Letters, e70105.

  2. 2025

    Lundquist, M.J., Lovejoy, P.C., Fay, B.G., Hernandez, J.E., Madrid, M. Bug Roads: Modeling Green Space Connectivity and Pollinator Habitat in a Large City Using Open GIS Data and Tools. Ecological Applications, 35(7), e70128.

  3. 2024

    Shen, M. et al. (including Lundquist, M.J.). FreshLanDiv: A global database of freshwater biodiversity across different land uses. Global Ecology and Biogeography, 33, e13917.

  4. 2023

    Lundquist, M.J., Scott, E.A. Patterns of aquatic insect biodiversity in the highly urbanized Bronx River, NY. Northeastern Naturalist, 30(2), 122–134.

The lab

People

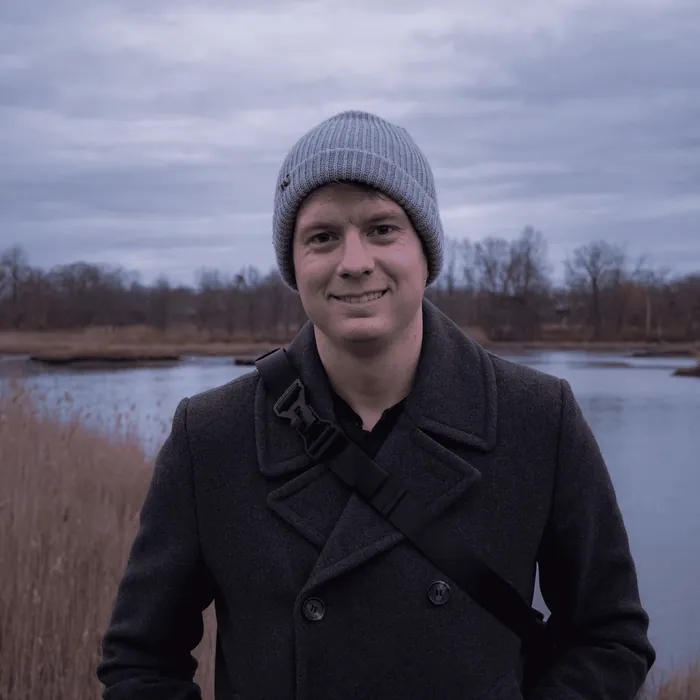
Dr. Matthew J. Lundquist

Principal Investigator

Dr. Matthew J. Lundquist

Associate Teaching Professor

Chair, Urban Ecosystem Ecology Section, Ecological Society of America

I study how the structure of cities affects habitat connectivity, freshwater communities, pollinators, and green infrastructure. That work draws on field surveys as well as GIS, remote sensing, spatial models, and genomic analysis.

Student collaborators

Student researchers have shaped every major line of work in the lab.

Brianna Fay

Brianna Fay

Bug Roads pollinator dispersal modeling

Juliet Hernandez

Juliet Hernandez

Bronx River trophic ecology and blacknose dace diets

Isabelle Fehr

Isabelle Fehr

Mitochondrial DNA identification of native pollinators

Victoria Perez

Victoria Perez

Physiology of aquatic insects in the Bronx River

Christa Coburn

Christa Coburn

Effects of urbanization on mayflies in the Bronx River

Elizabeth Scott

Elizabeth Scott

Green roof assessment and aquatic insect diversity in the Bronx River

Martha Madrid

Martha Madrid

GIS analysis of tourism and green-space distribution in New York City

Hope Kenmore

Hope Kenmore

Insect biodiversity in urban tree-pit habitats

Madison Weisend

Madison Weisend

Water scarcity and insect diversity in tree-pit habitats

Contact

Lundquist Urban Ecology Lab